Bending Moment Diagram: A Comprehensive Guide For Engineers
24 Shares930 Views
A Bending Moment Diagram (BMD) is a critical tool in structural engineering that visually represents the variation of the bending moment along the length of a structural element, like a beam. Understanding and correctly constructing these diagrams are fundamental for designing safe and efficient structures.
What is a Bending Moment?
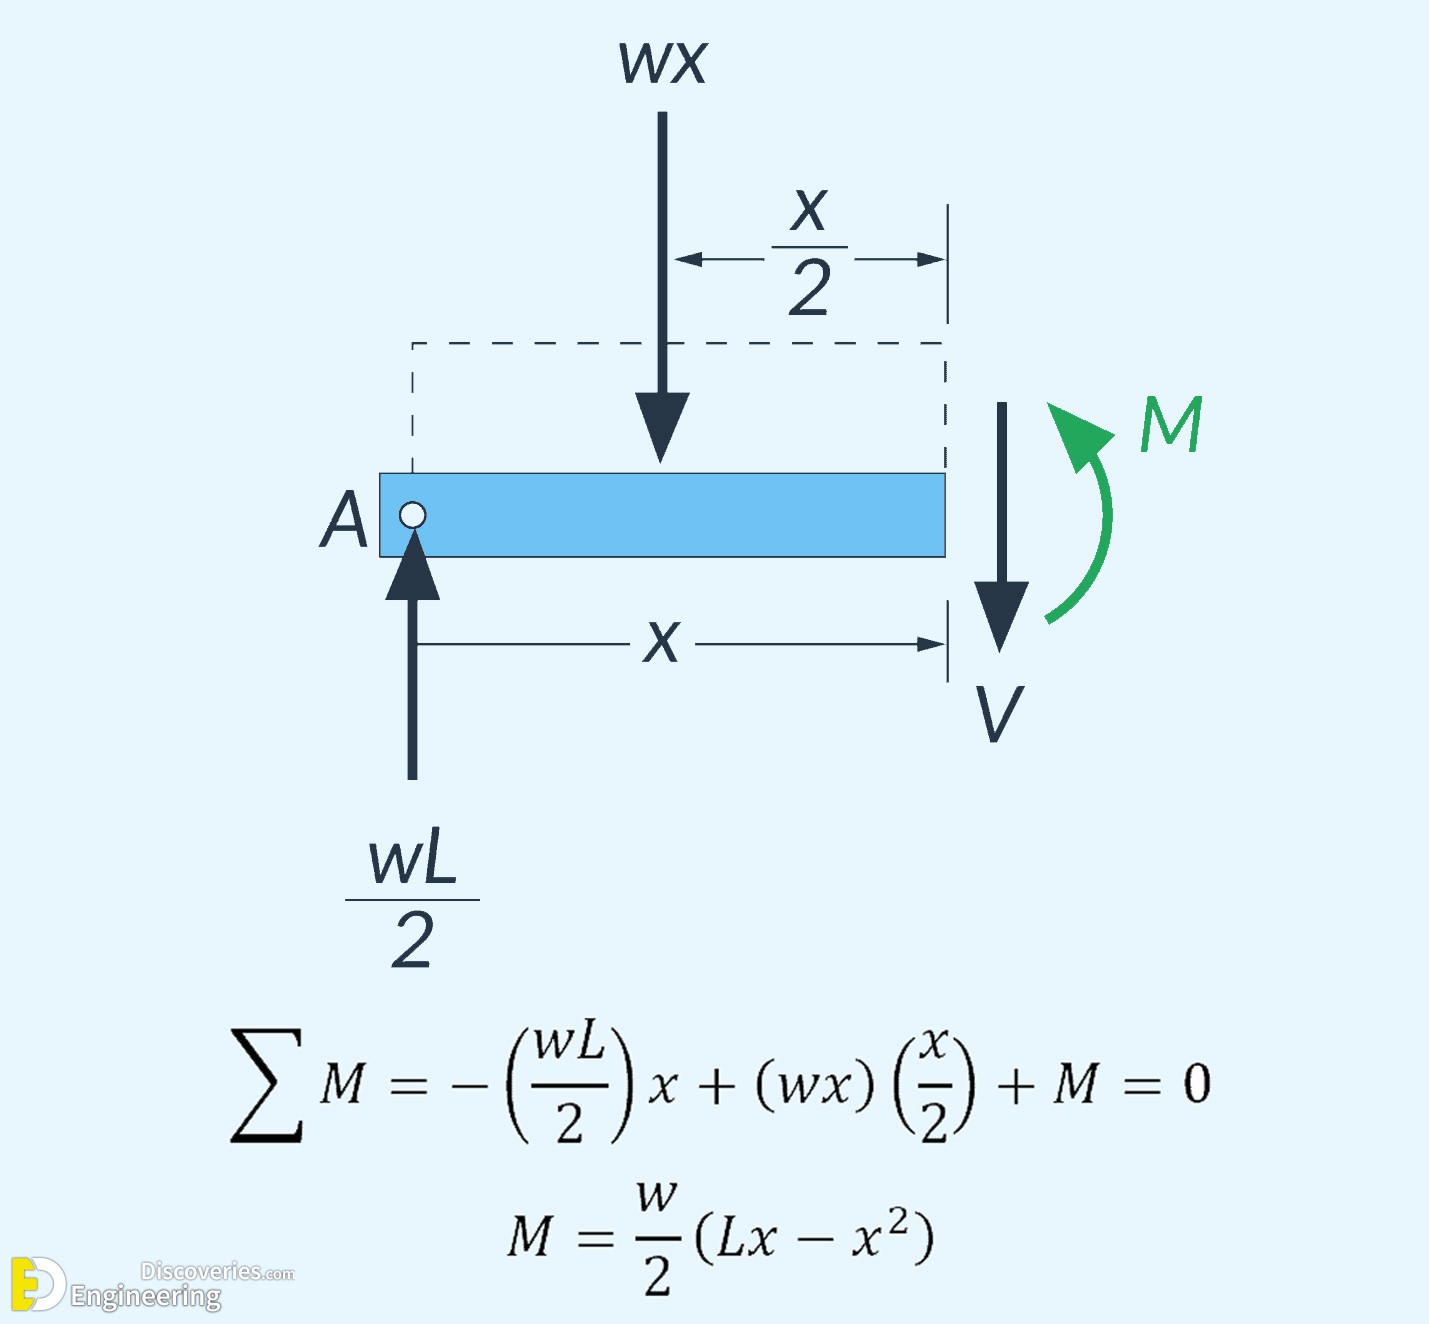
A bending moment is the internal resistance of a structural member to the bending action caused by external loads. It’s a rotational force that causes the member to bend, creating tension on one side and compression on the other. This moment is calculated by multiplying the magnitude of the external force by the perpendicular distance from the point of interest.
Purpose of a Bending Moment Diagram
The primary purpose of a BMD is to identify the maximum and minimum bending moments along a structural member. These critical values are essential for:
Structural Design: Engineers use the maximum bending moment to determine the required size and strength of a beam or other structural element. This ensures the member can safely withstand the applied loads without failing.
Stress Analysis: Bending moments directly relate to the bending stress within the material. By analyzing the BMD, engineers can pinpoint locations of maximum stress.
Reinforcement Placement: In materials like concrete, which are strong in compression but weak in tension, the BMD helps determine where to place reinforcing steel to resist the tensile forces generated by the bending moment.
Key Concepts for Constructing a BMD
To accurately draw a bending moment diagram, you need to be familiar with a few key concepts:
Shear Force
Shear force is the internal force that acts perpendicular to the longitudinal axis of a beam. It’s a result of the external transverse loads. The shear force diagram (SFD) is often constructed before the BMD, as there’s a direct relationship between them.
Sign Convention
A consistent sign convention is crucial for creating and interpreting BMDs. While conventions can vary, a common one is:
Positive Bending Moment (Sagging): A moment that causes a beam to bend in a “U” shape, with compression in the top fibers and tension in the bottom fibers.
Negative Bending Moment (Hogging): A moment that causes a beam to bend in an “n” shape, with tension in the top fibers and compression in the bottom fibers.
Relationship Between Load, Shear, and Bending Moment
These three elements are intrinsically linked, and their relationships can be expressed mathematically:
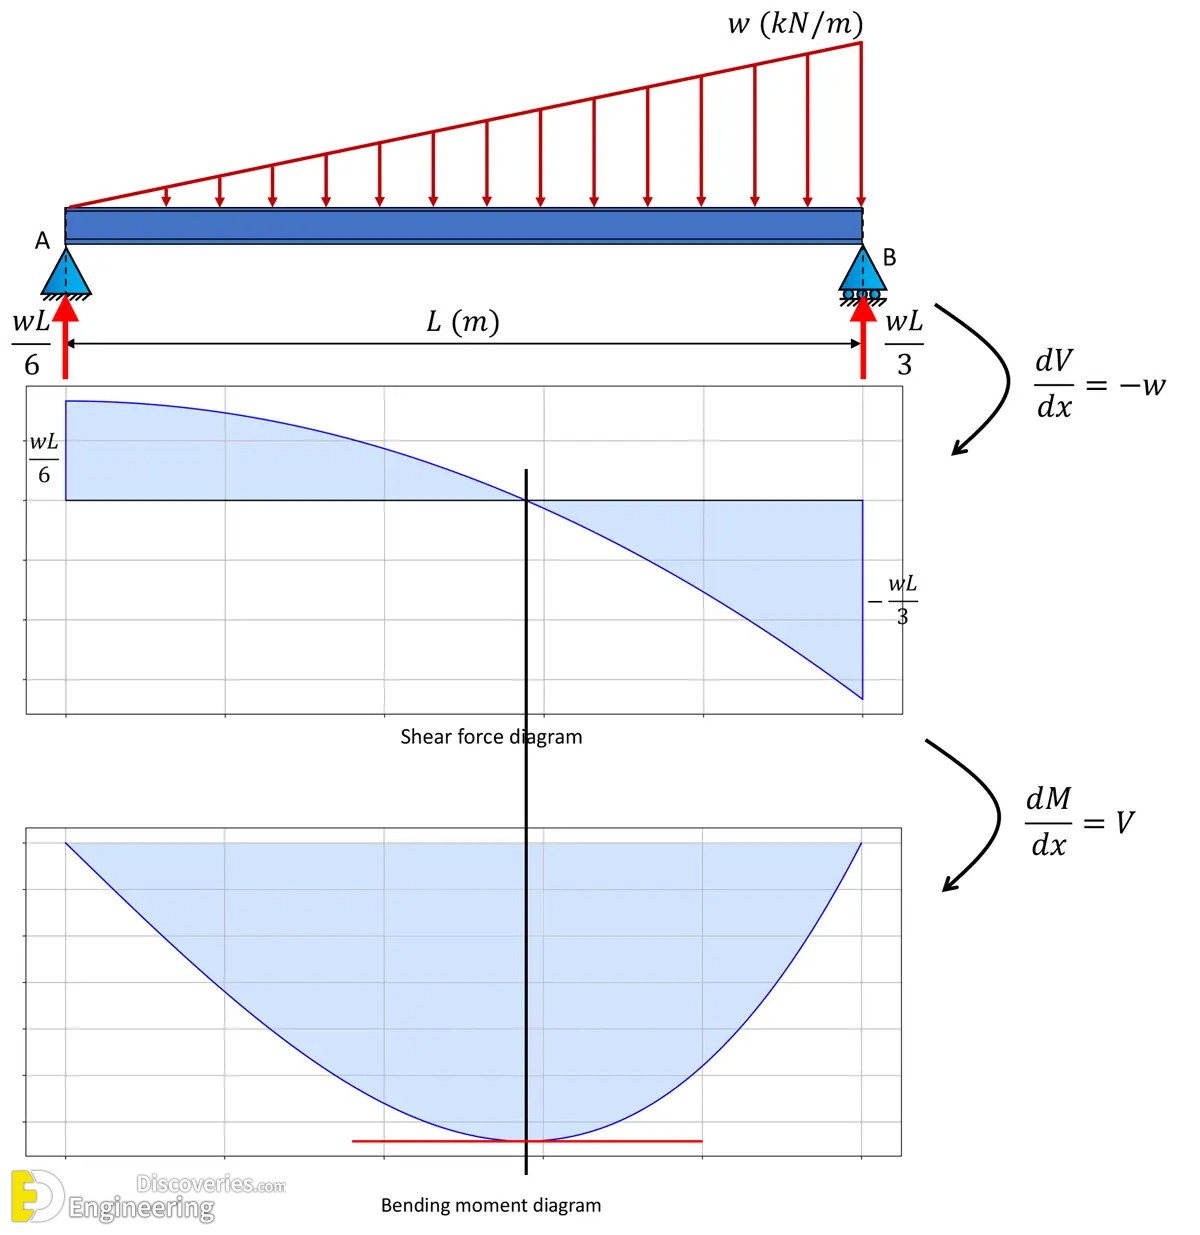
The rate of change of shear force along the beam is equal to the intensity of the distributed load. Mathematically, this is expressed as:
dV/dx =−w(x)
Where V is the shear force, x is the position along the beam, and w(x) is the distributed load.
The rate of change of the bending moment along the beam is equal to the shear force. This can be written as:
dM/dx =V(x)
Where M is the bending moment.
From these relationships, we can deduce that the area under the shear force diagram between two points is equal to the change in bending moment between those two points. Also, the maximum bending moment occurs where the shear force is zero.
How to Draw a Bending Moment Diagram
Here’s a step-by-step guide to constructing a BMD for a simple beam:
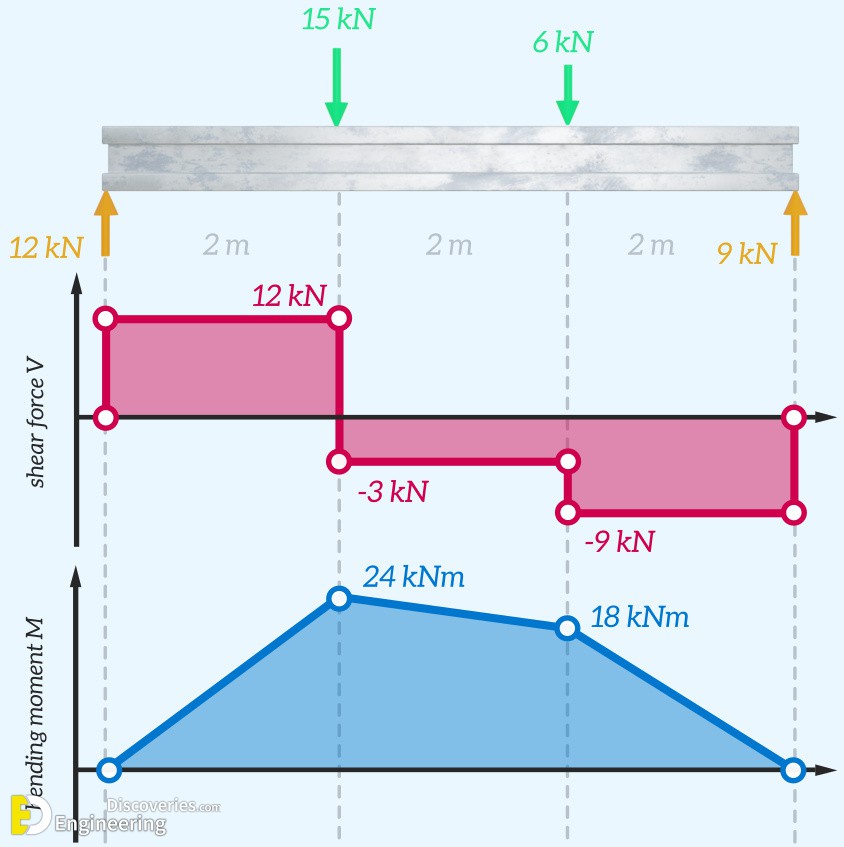
Calculate Support Reactions: The first step is to determine the forces exerted by the supports on the beam. This is done by applying the equations of static equilibrium: the sum of forces in the vertical direction is zero, and the sum of moments about any point is zero.
Draw the Shear Force Diagram (SFD):
Start at the left end of the beam and move to the right.
At a point load, the SFD will “jump” up or down by the magnitude of the load.
For a uniformly distributed load, the SFD will be a straight line with a slope equal to the load intensity.
For a section with no load, the shear force remains constant.
Draw the Bending Moment Diagram (BMD):
Start at the left end of the beam. The bending moment at a free end or a simple support is typically zero.
The change in bending moment between two points is the area of the SFD between those points.
If the shear force is constant (a horizontal line on the SFD), the bending moment will change linearly (a sloped straight line on the BMD).
If the shear force is linear (a sloped line on the SFD), the bending moment will be parabolic (a curved line on the BMD).
The point of maximum bending moment will be where the SFD crosses the zero axis.
Common Beam Types and Their BMDs
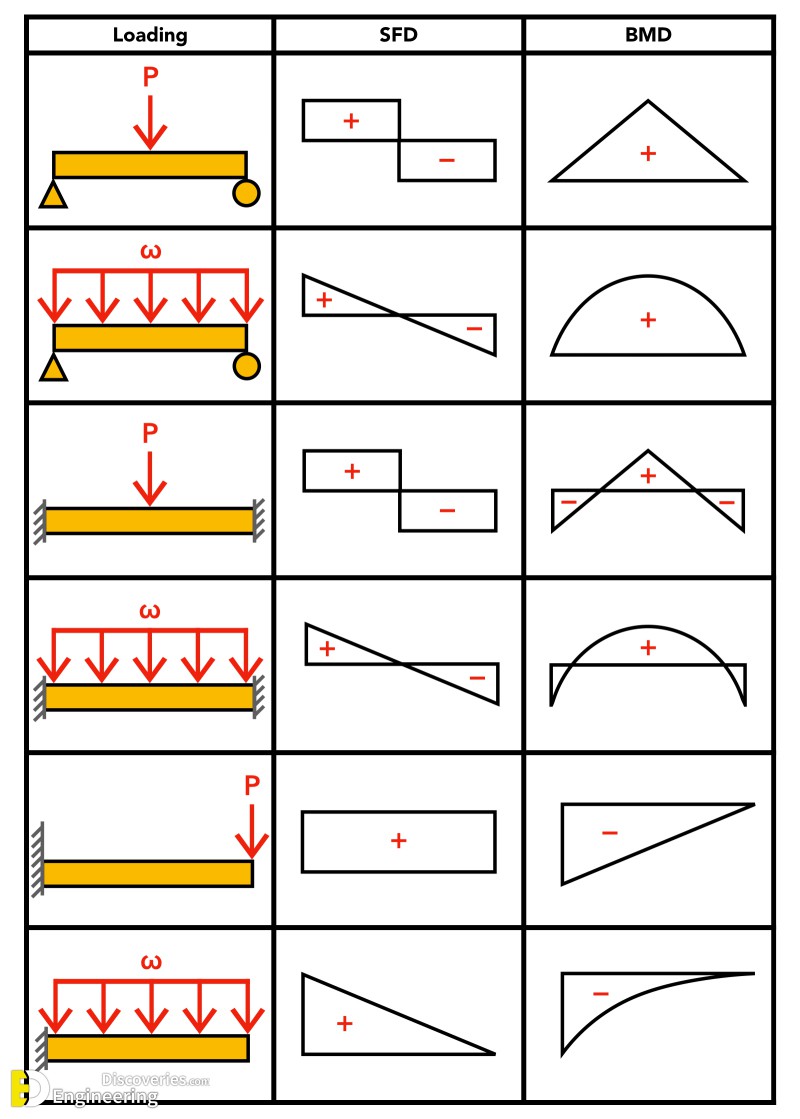
Simply Supported Beam with a Point Load at the Center: The BMD is a triangle with the maximum moment at the center.
Simply Supported Beam with a Uniformly Distributed Load: The BMD is a parabola with the maximum moment at the center.
Cantilever Beam with a Point Load at the Free End: The BMD is a triangle with the maximum moment at the fixed support.
Cantilever Beam with a Uniformly Distributed Load: The BMD is a parabola with the maximum moment at the fixed support.
By mastering the principles of bending moment diagrams, engineers can ensure the structural integrity and efficiency of their designs.
For a visual explanation of how to construct these diagrams, you might find this video on drawing shear force and bending moment diagrams helpful.