Have you ever looked at a topographic map and wondered what all those squiggly lines mean? Those lines, known as contour lines, are more than just random marks—they represent the shape of the land! Understanding contour lines is like reading the earth’s surface. In this guide, we’ll dive into what contour lines are and how you can read them.
The Basics of Contour Lines
Definition of Contour Lines
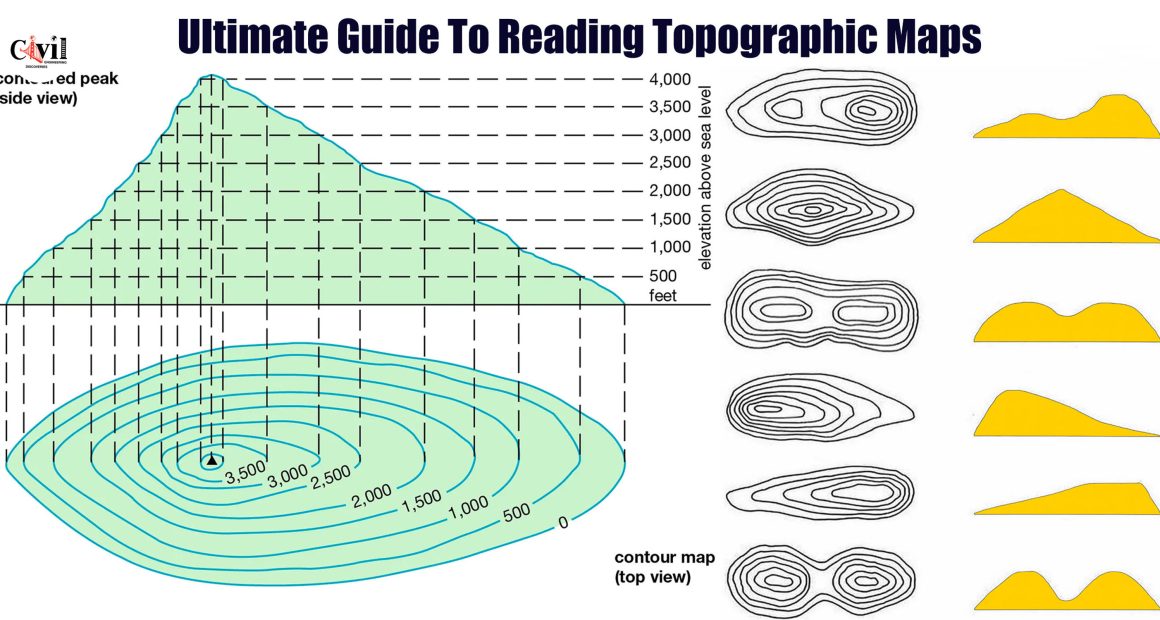
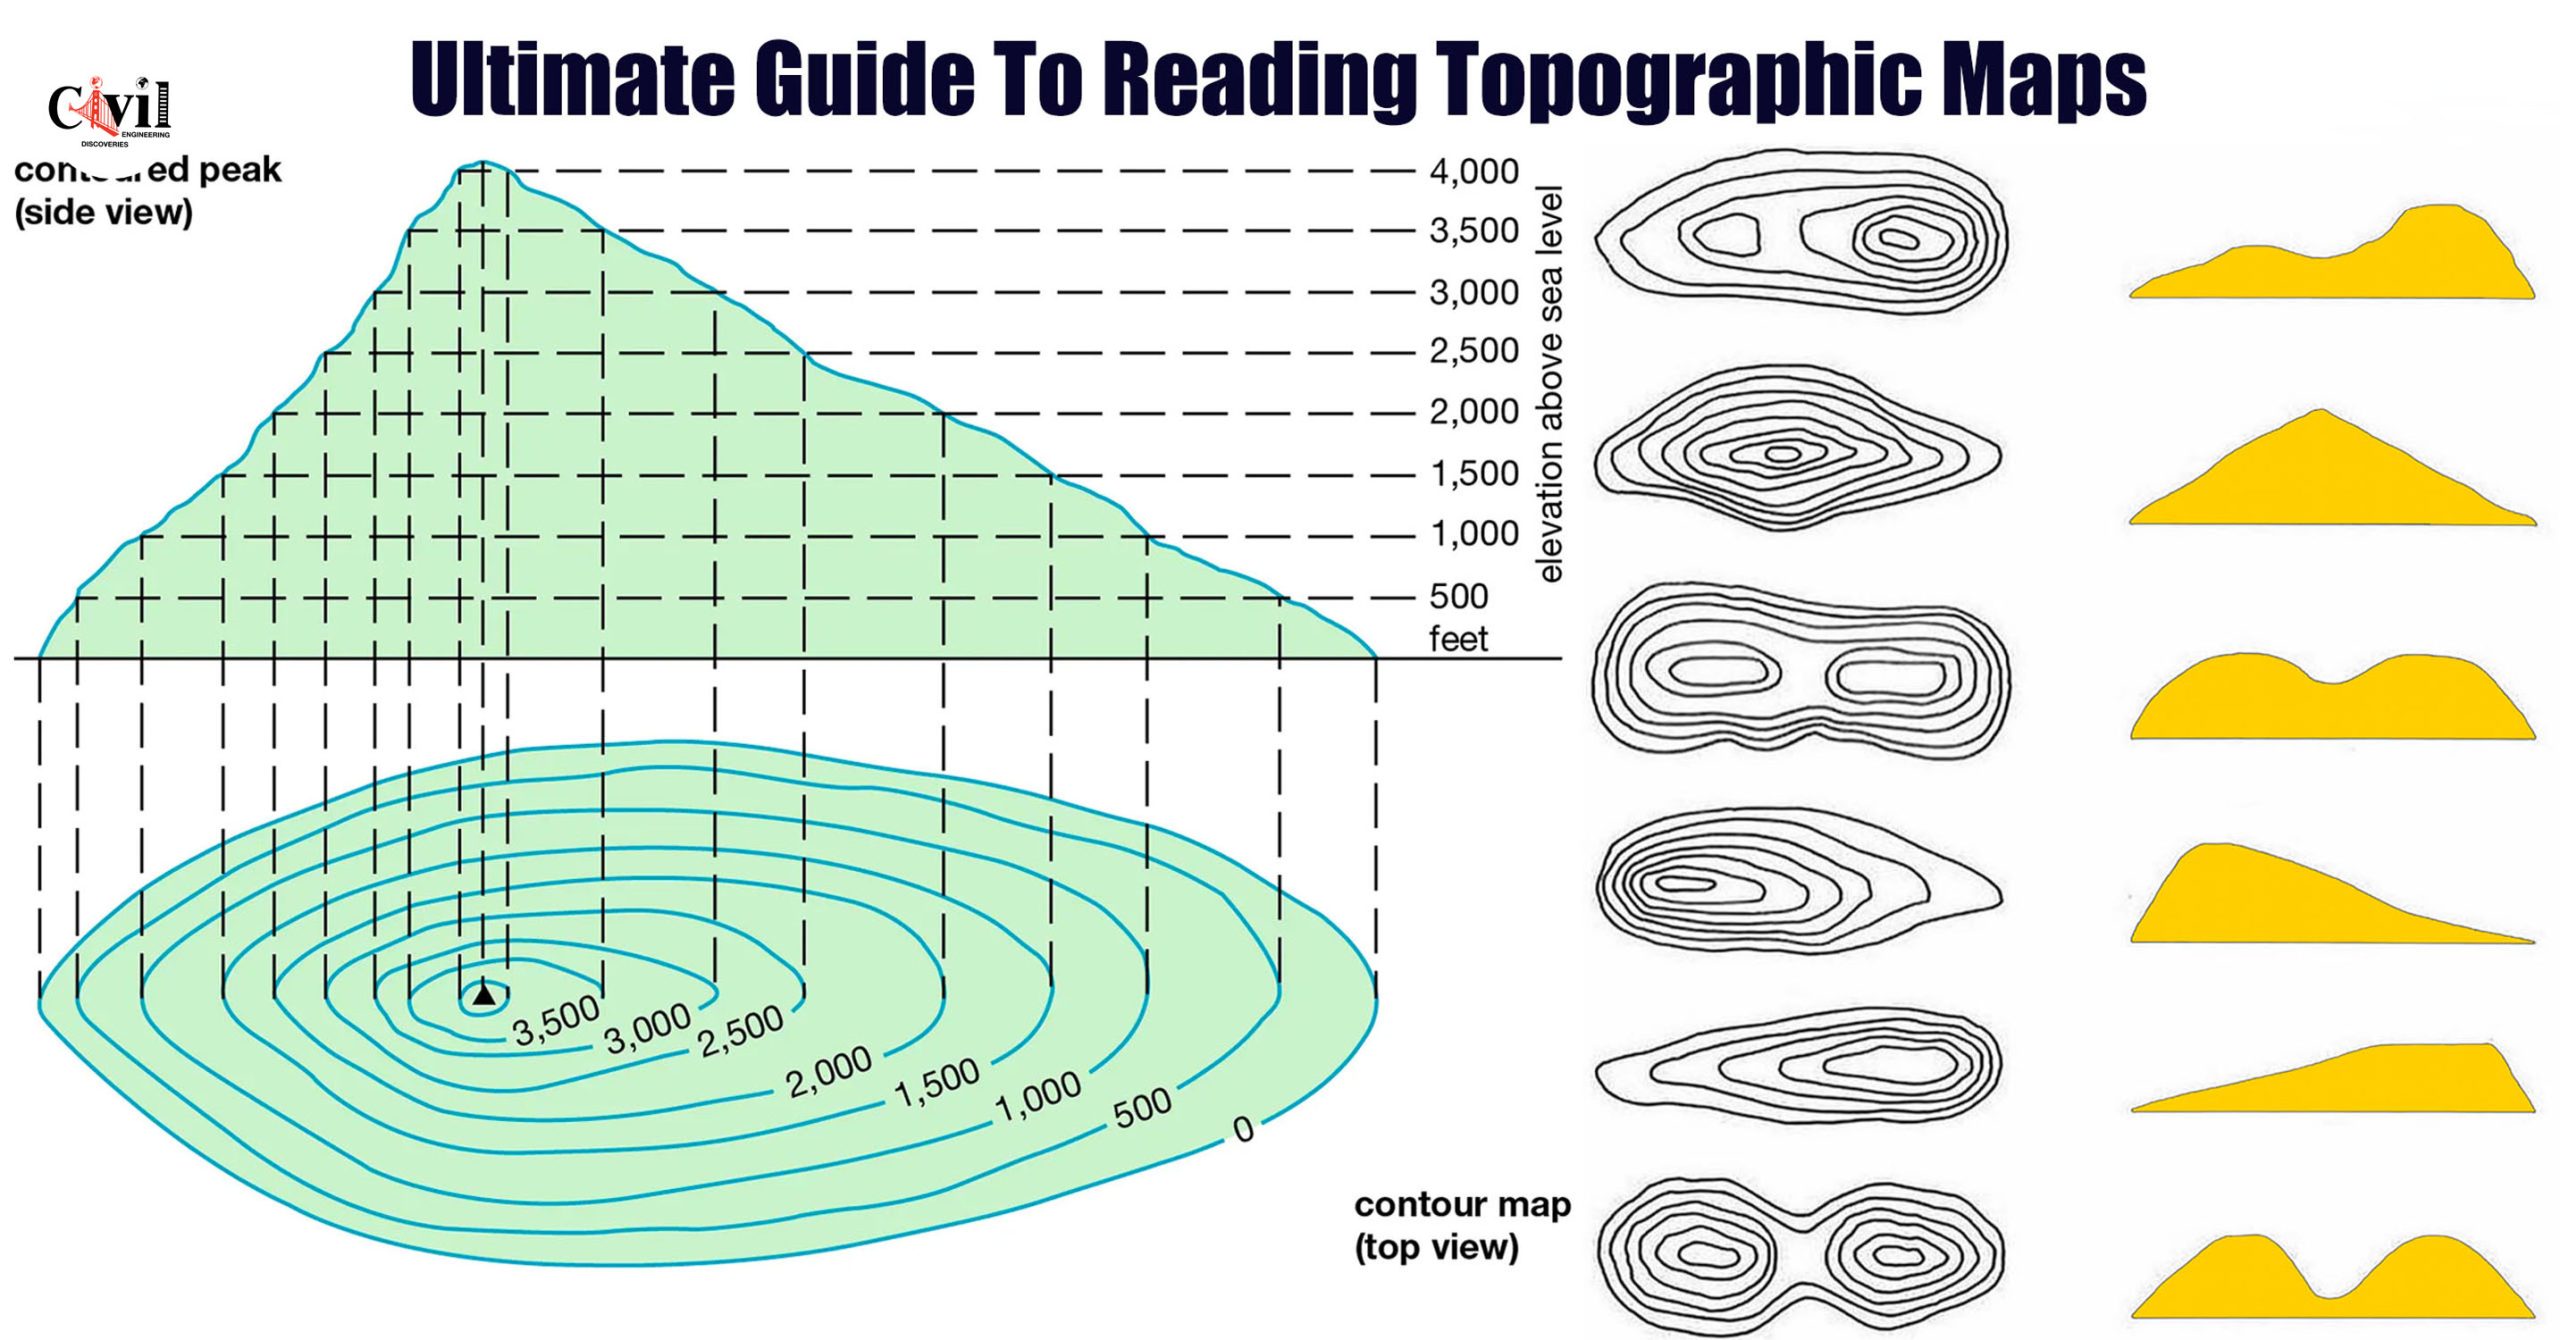
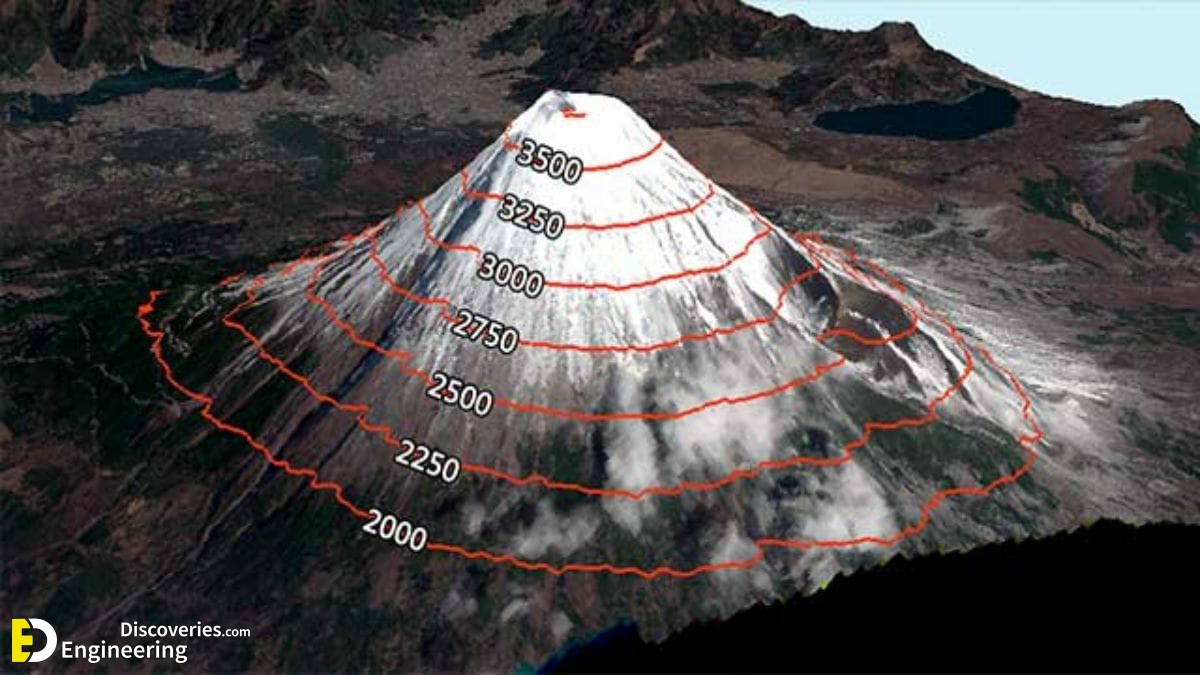
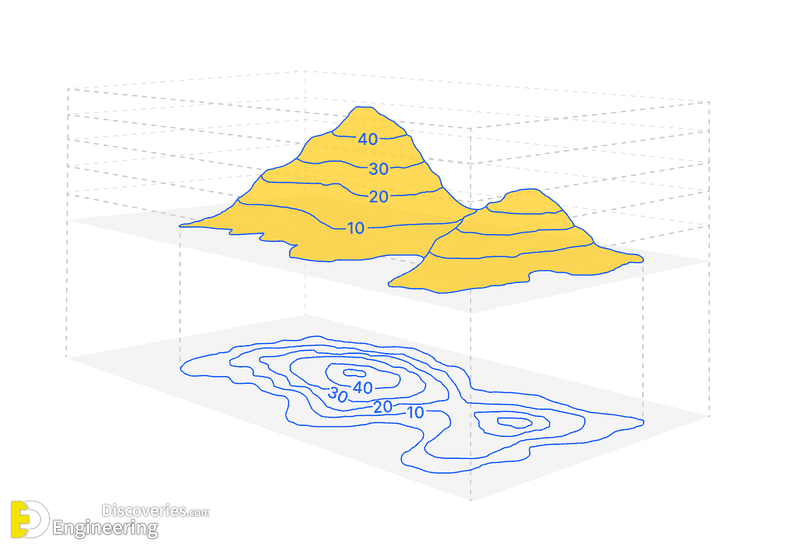
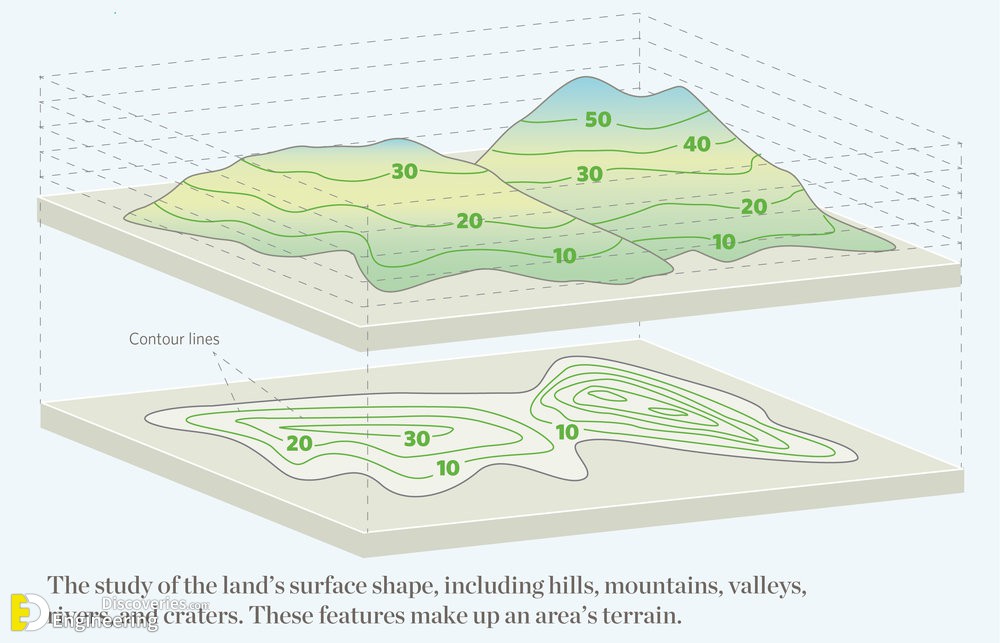
In the simplest terms, contour lines are lines on a map that connect points of equal elevation. Imagine you’re on a mountain, and you walk around it at the same height without going up or down. The path you create would be a contour line. These lines help us visualize the terrain and understand the rise and fall of the land.
Importance of Contour Lines in Cartography
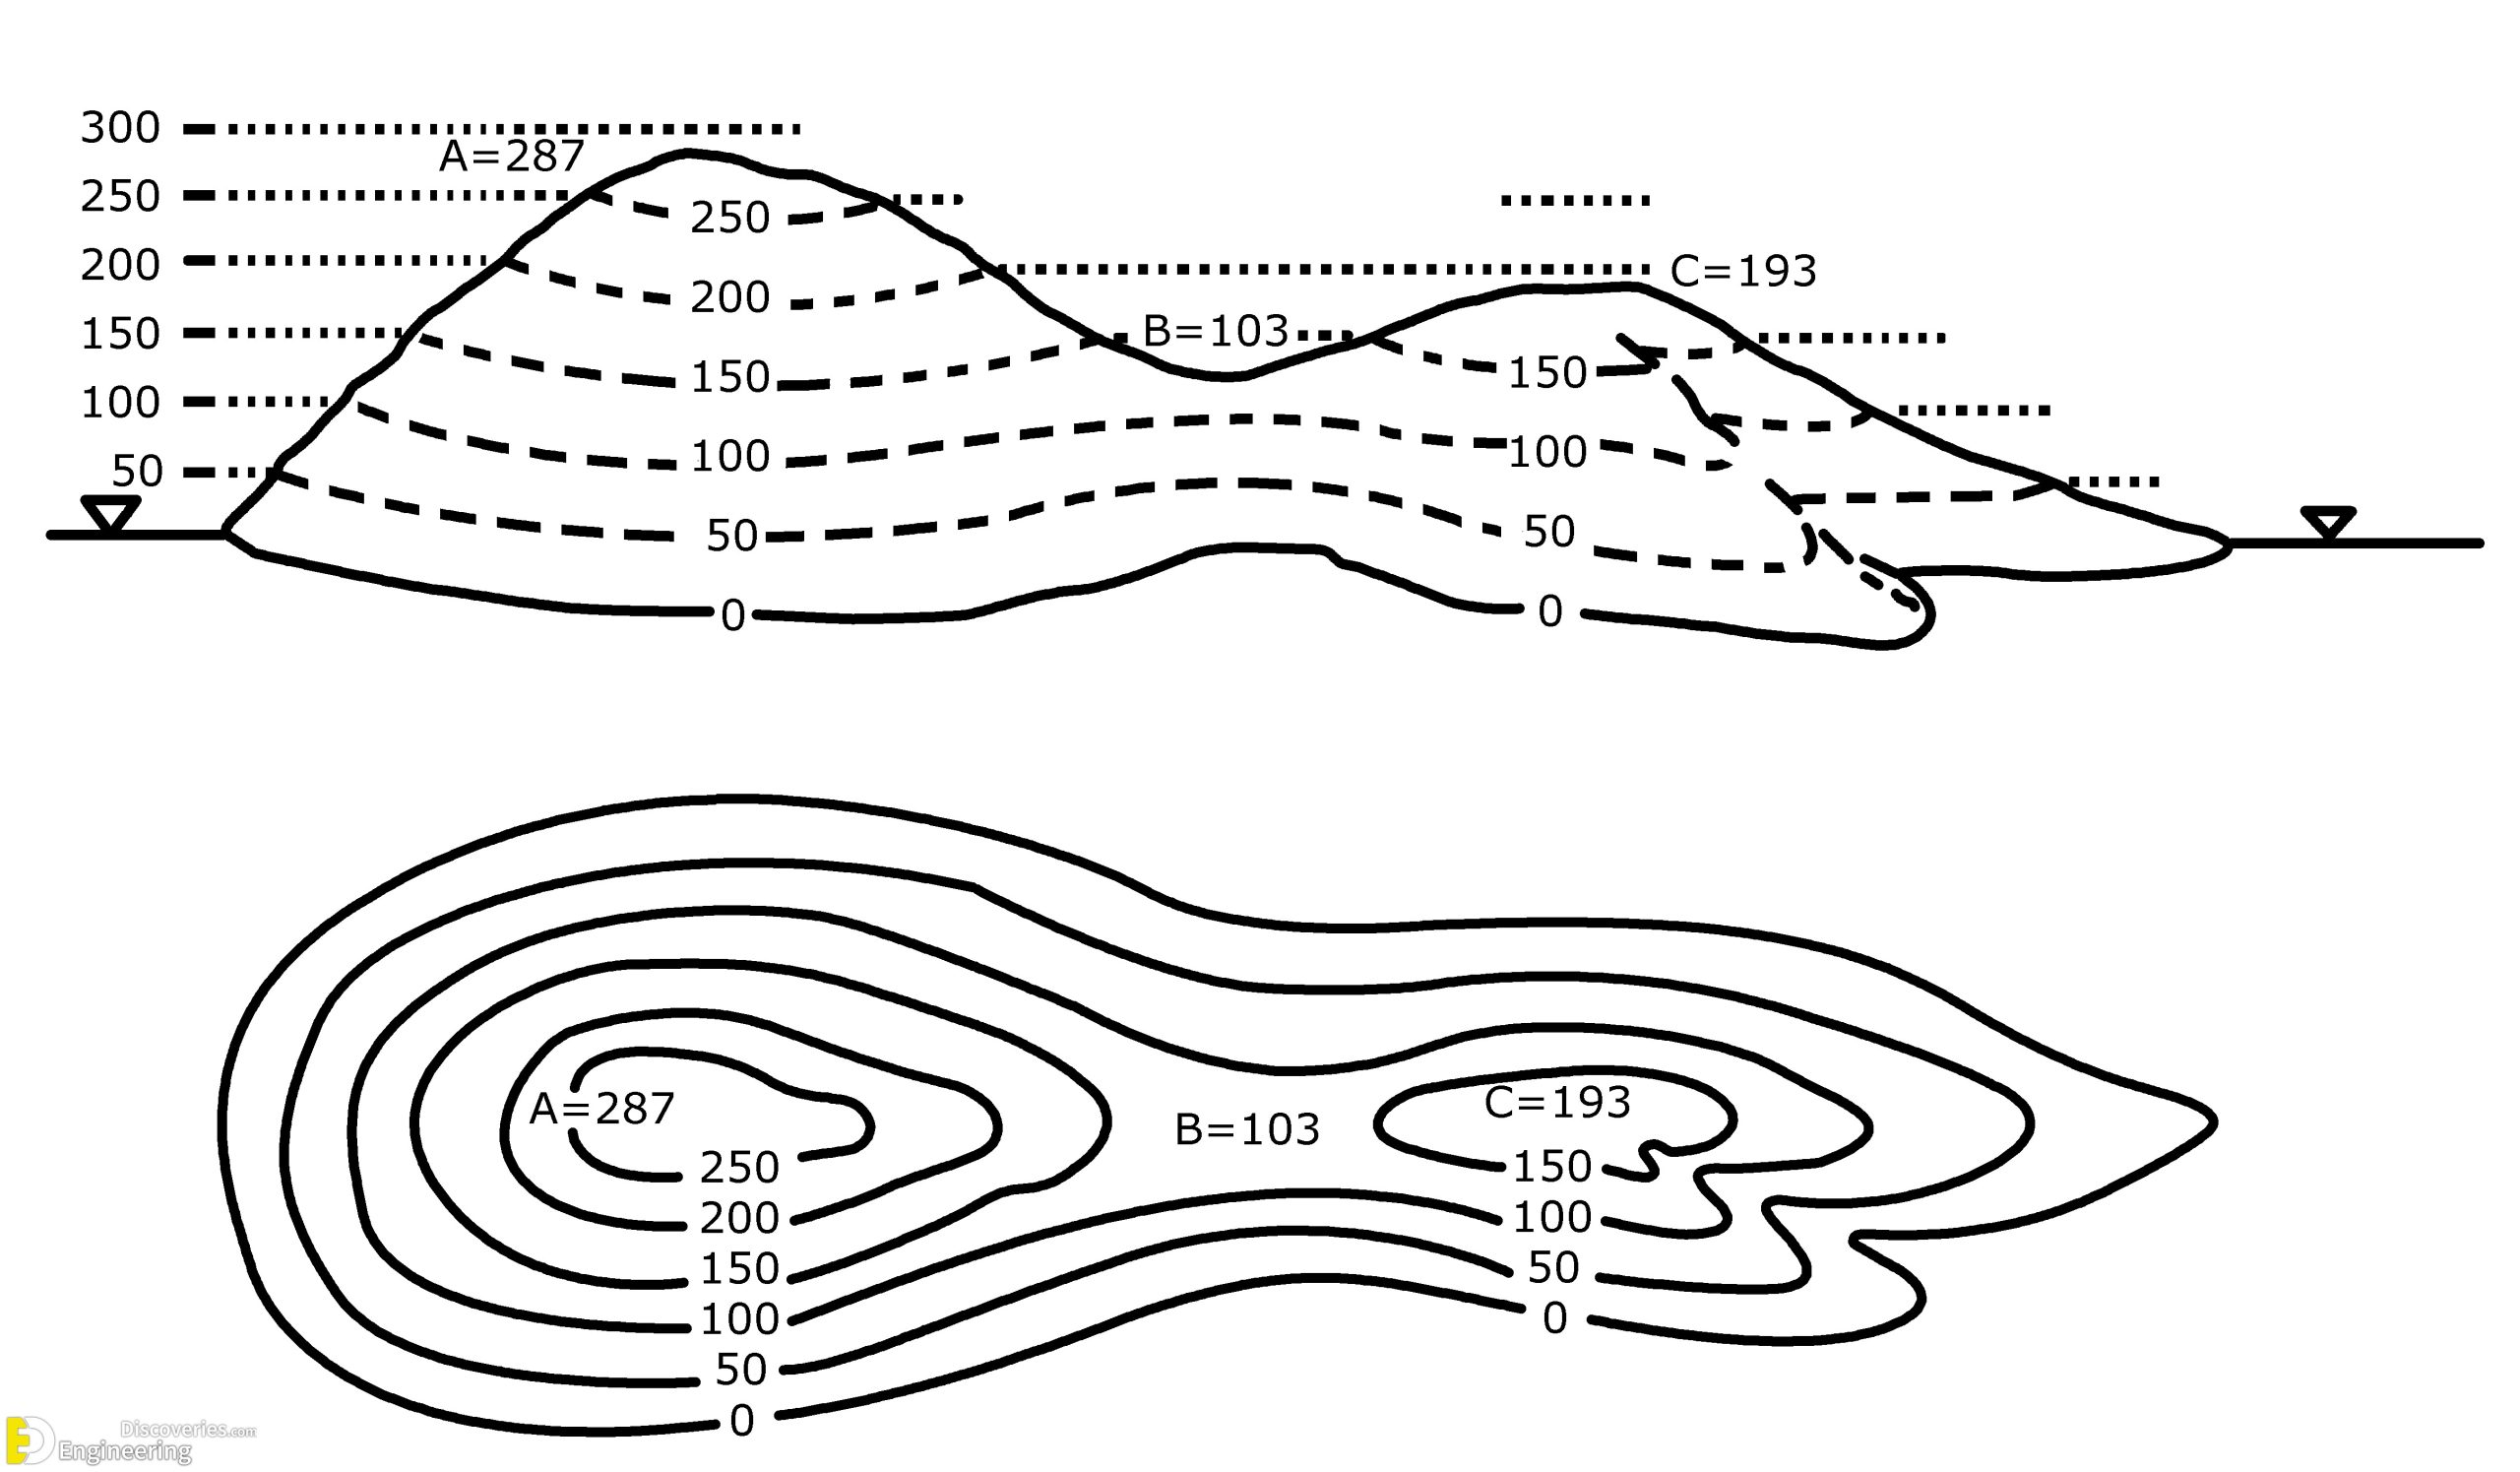
Contour lines are crucial in cartography because they allow us to represent 3D terrain on a 2D surface. Without them, maps would be flat and wouldn’t provide any information about the height of hills, mountains, valleys, or depressions. Contour lines give life to maps, making them essential for activities like hiking, construction, and even military operations.
Types of Contour Lines
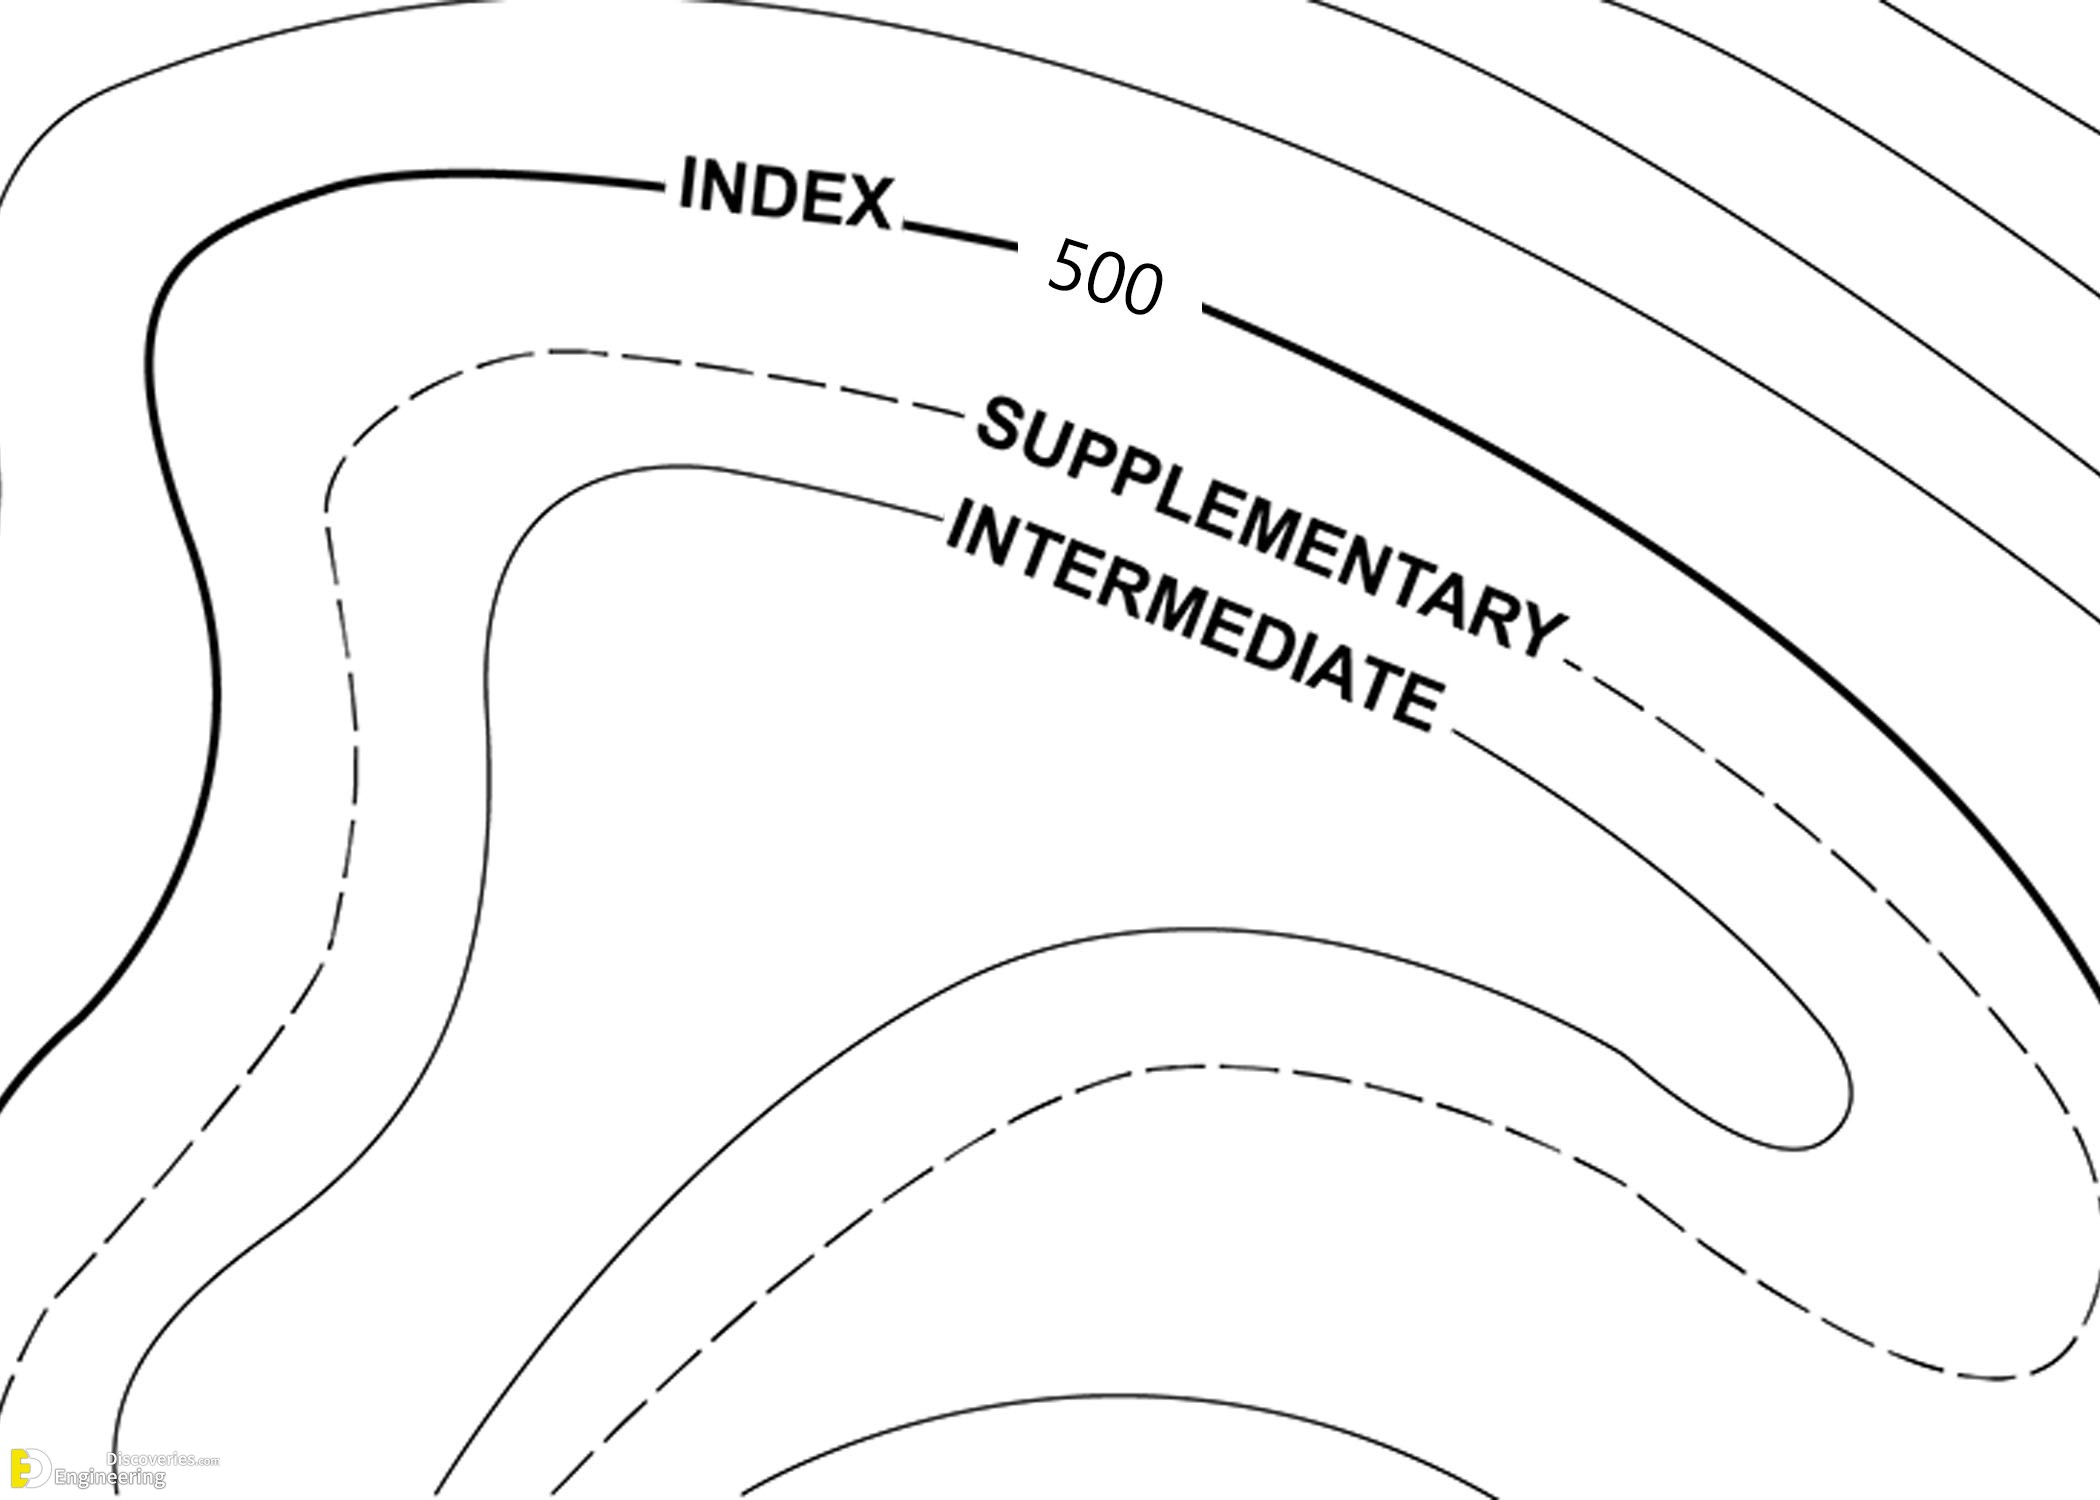
Index Contour Lines
Index contour lines are the boldest lines on a topographic map. They usually have numbers on them indicating the elevation. For example, an index contour might be marked with a “500,” meaning that the line represents a height of 500 meters (or feet, depending on the map).
Intermediate Contour Lines
Between index contour lines, you’ll find intermediate contour lines. These are the finer, less bold lines that provide additional detail. They don’t have elevation numbers, but they help you see more subtle changes in the terrain.
Supplementary Contour Lines
In areas where the terrain is very flat, supplementary contour lines may be used. These dashed lines indicate minor elevation changes and help fill in the gaps when regular contour lines are too far apart.
Understanding Contour Intervals
Definition of Contour Interval
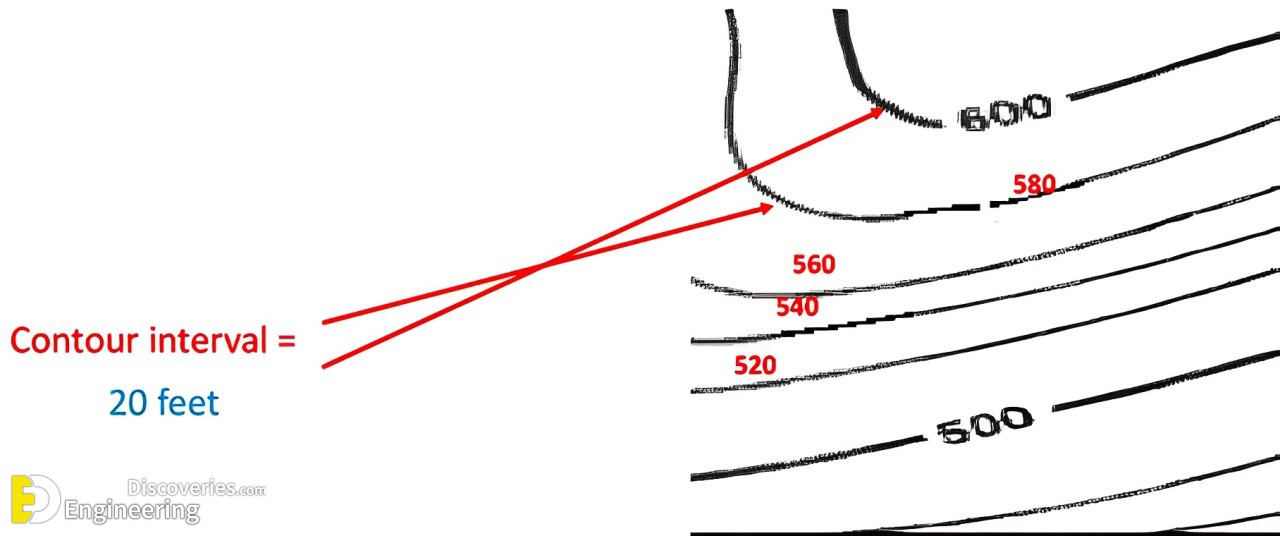
A contour interval is the difference in elevation between two consecutive contour lines. If the contour interval on your map is 20 feet, that means each line represents a 20-foot elevation change. Knowing the contour interval helps you understand the steepness of the terrain.
How to Calculate Contour Intervals
To calculate the contour interval, find the difference in elevation between two index contour lines and divide it by the number of spaces between them. For example, if two index lines are 100 meters apart and there are five intermediate lines between them, the contour interval is 20 meters.
How to Read Contour Lines on a Map
Identifying Elevation Changes
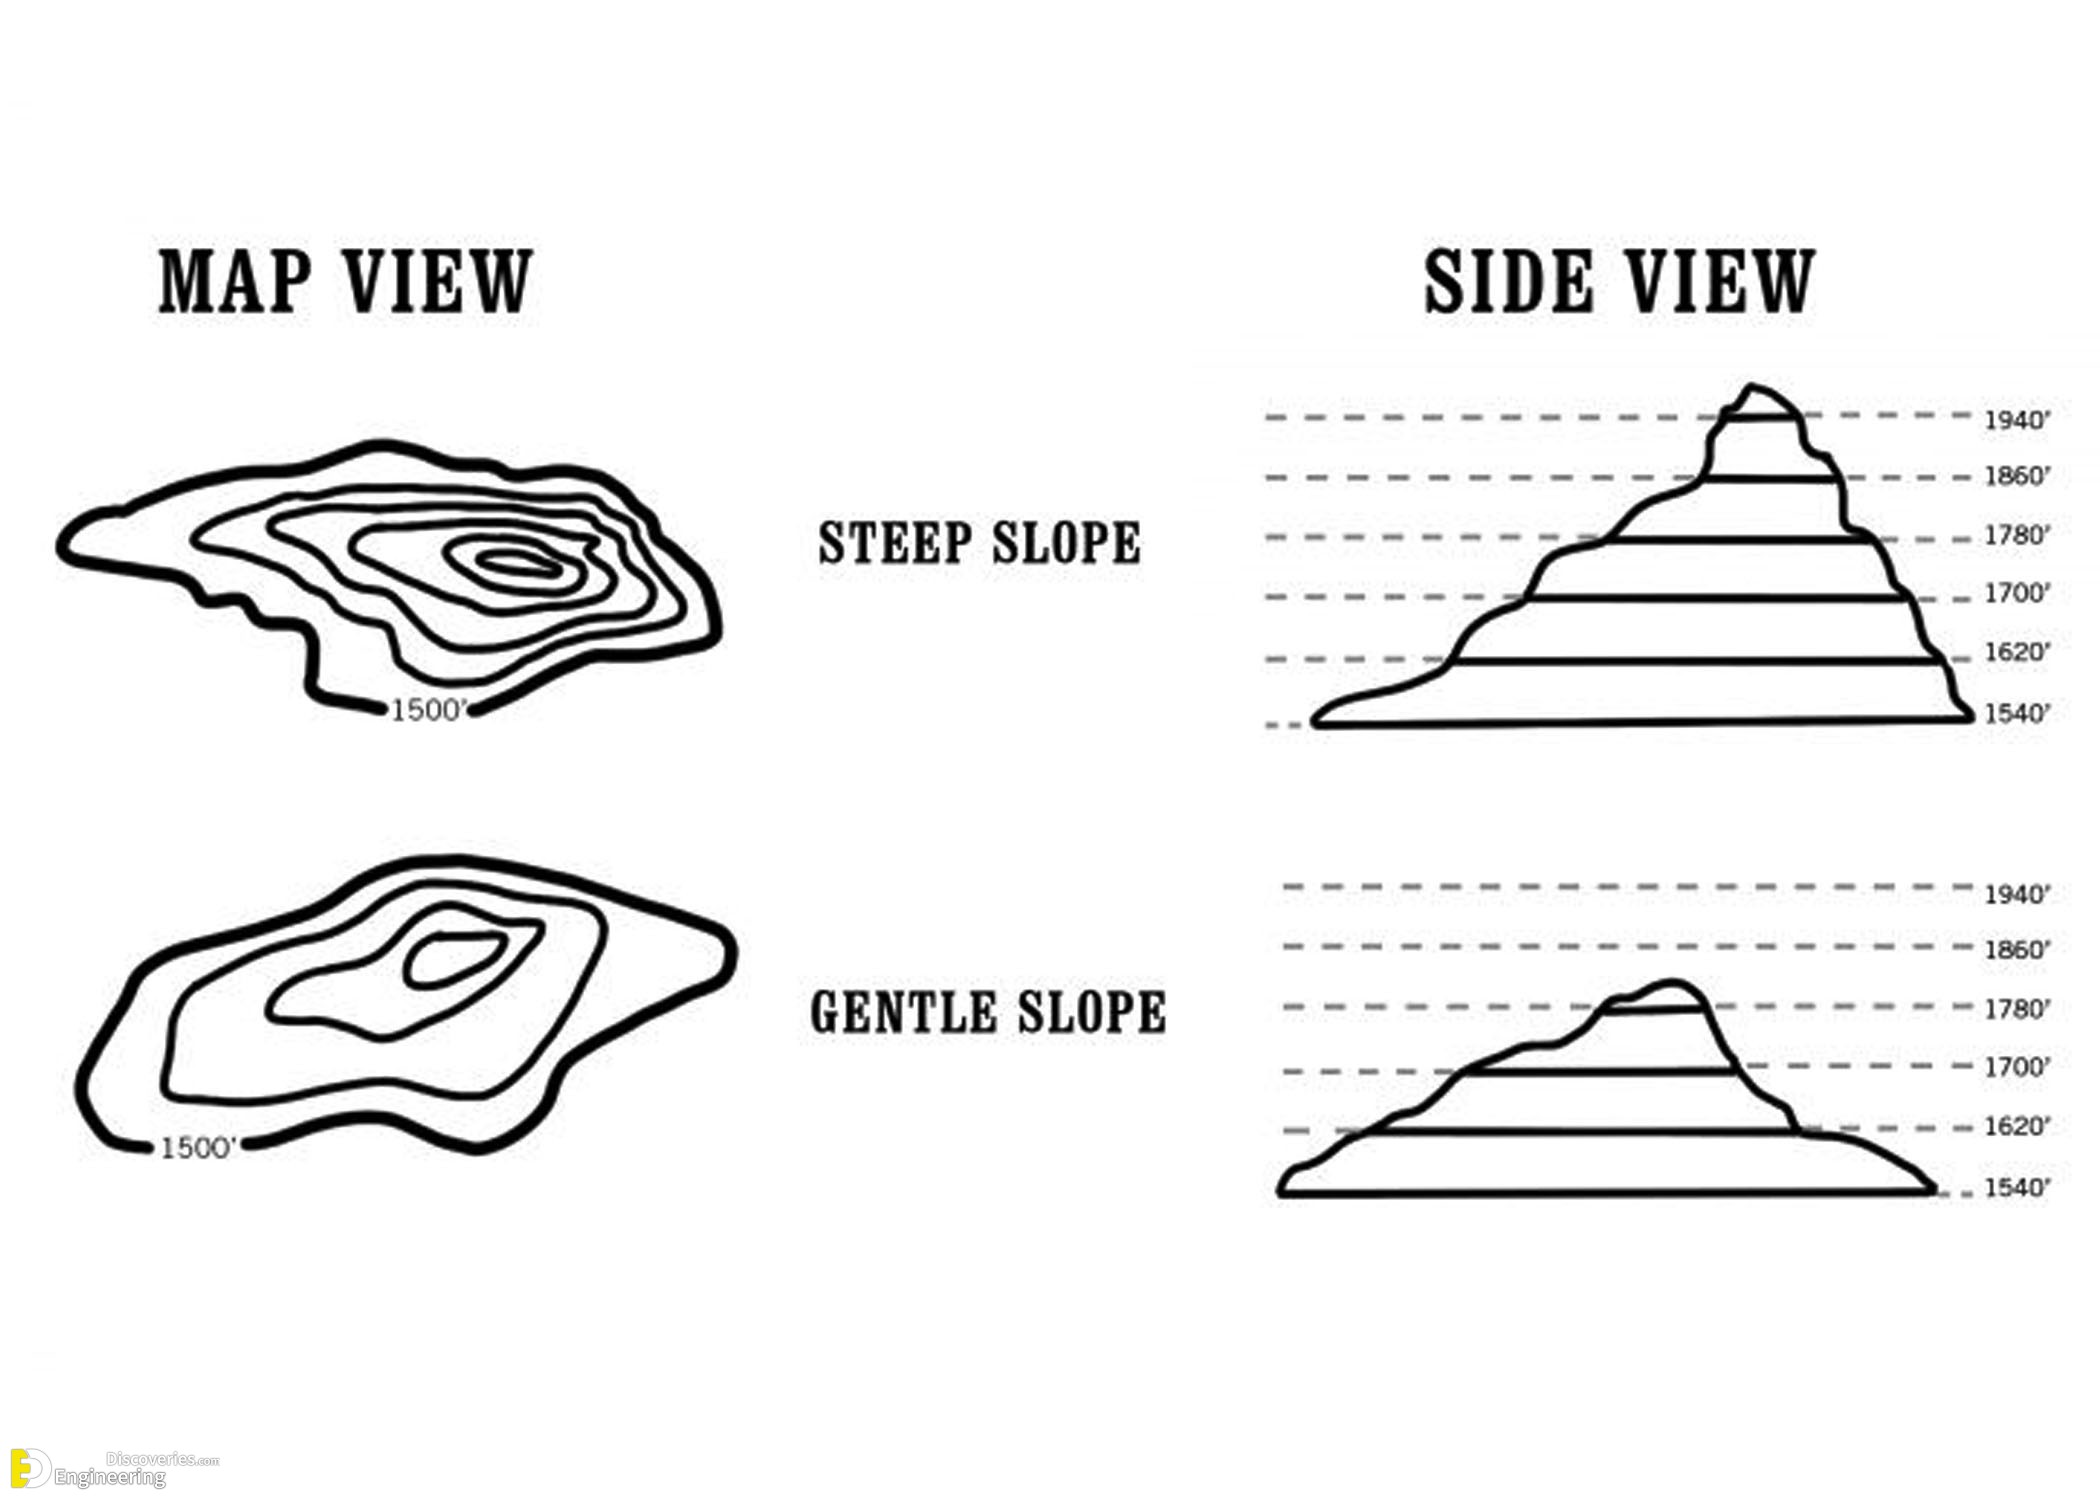
The first step in reading contour lines is identifying how they show elevation. When contour lines are close together, it indicates a steep slope. Conversely, lines that are far apart suggest a gentle slope or flat terrain.
Recognizing Terrain Features
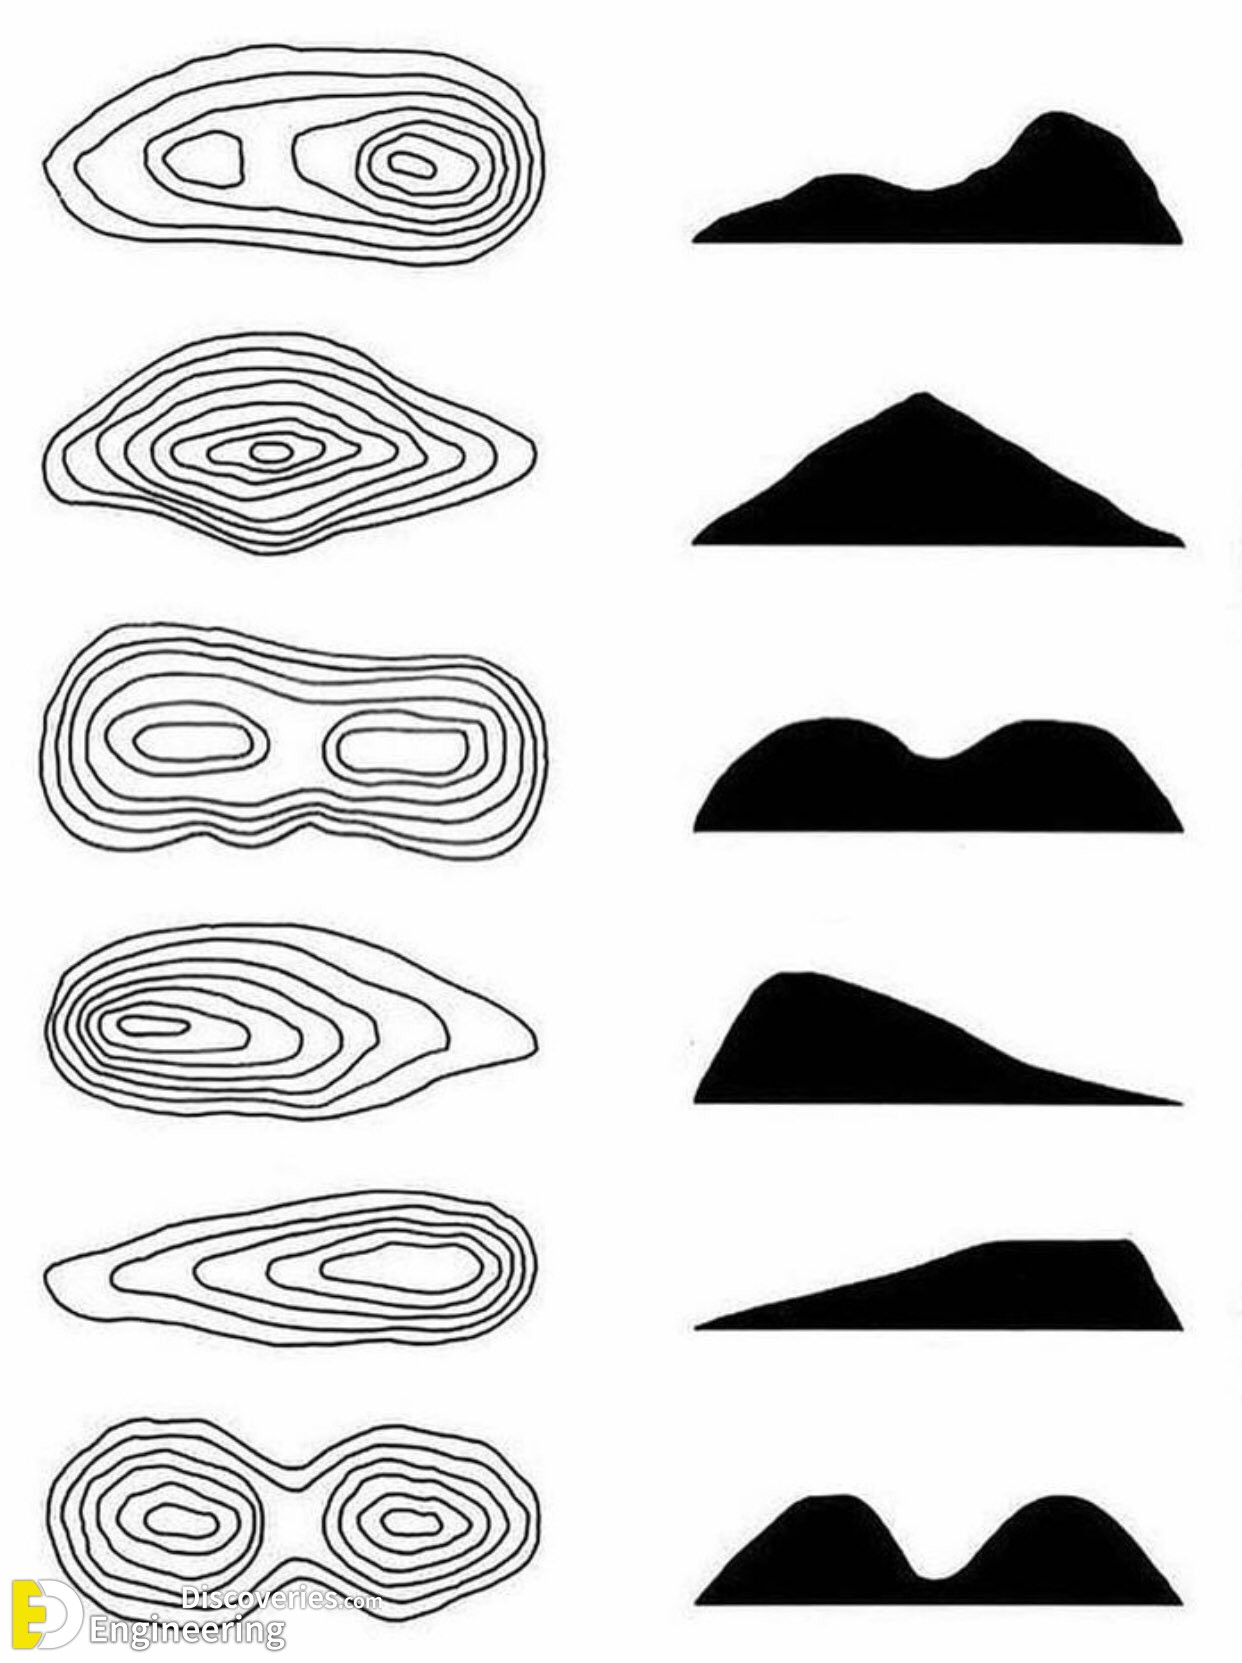
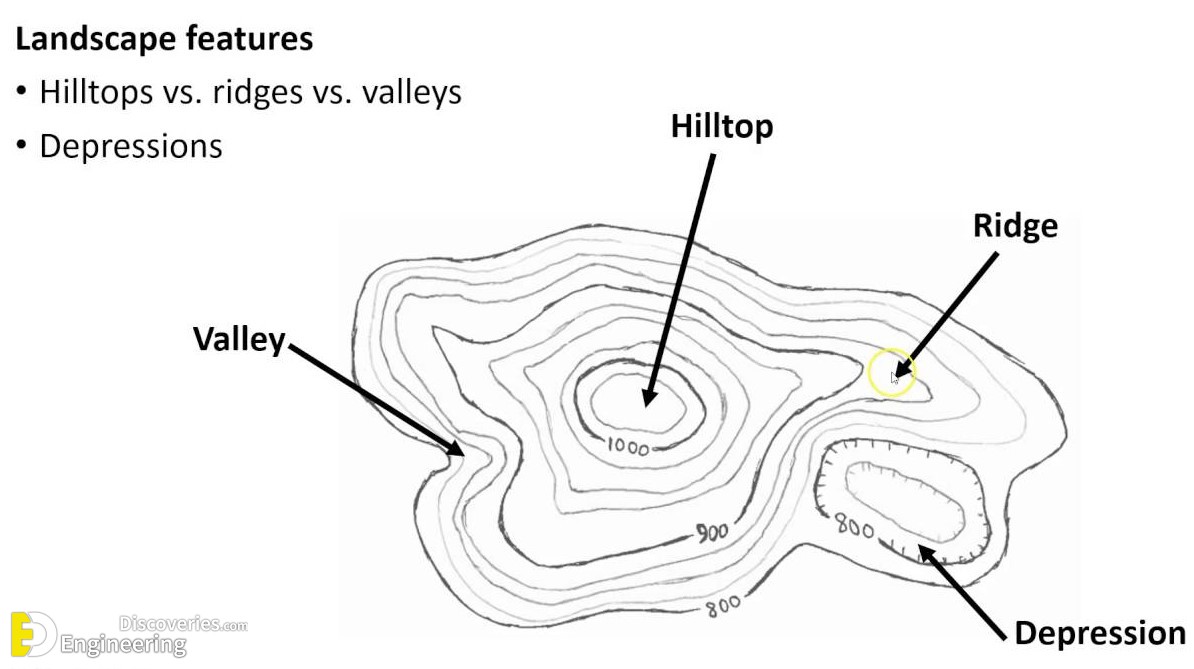
Contour lines can also help you recognize specific terrain features. For example, concentric circles of contour lines typically indicate a hill or a mountain. If those circles are broken by V- or U-shaped lines, you might be looking at a valley or a ridge.
Hills and Valleys
Hills are shown by closed circles of contour lines. The smaller the circle, the higher the hill. Valleys, on the other hand, are depicted by V-shaped contour lines that point uphill.
Depressions and Ridges
Depressions are marked by contour lines with tick marks pointing towards lower elevation, while ridges are identified by U- or V-shaped contour lines that point downhill.
Using Contour Lines in Urban Planning
In urban planning, contour lines help architects and engineers understand the lay of the land before construction begins. They ensure buildings are designed to fit the landscape, preventing issues like flooding or landslides.
Advanced Tips for Reading Contour Lines
Understanding Closely Spaced Contour Lines
When contour lines are tightly packed together, the terrain is steep. This is important to note in activities like hiking or skiing, where steepness affects difficulty and safety.
Practical Applications of Contour Lines
For hikers and outdoor enthusiasts, contour lines are indispensable. They allow you to gauge the difficulty of a trail by showing the elevation changes along your route. Knowing how to read these lines can make the difference between a successful hike and getting lost in the wilderness.
Recognizing Flat and Steep Terrain
Flat terrain is represented by widely spaced contour lines, while steep terrain has closely spaced lines. Understanding this distinction can help you prepare better for your journey or project.
Common Mistakes When Interpreting Contour Lines
Misreading Contour Intervals
One of the most common mistakes is misreading the contour interval. Always double-check the map’s legend to understand the spacing between contour lines.
Confusing Elevation with Slope
Another mistake is confusing elevation with slope. Just because a point is high in elevation doesn’t mean it’s steep. Contour lines tell you both elevation and slope, so it’s essential to interpret them correctly.
How to Practice Reading Contour Lines
Hands-on Practice with Maps
The best way to get better at reading contour lines is to practice. Grab a topographic map and start interpreting the terrain. Try identifying hills, valleys, and ridges.
Using Digital Tools and Simulations
There are also digital tools and simulations available that can help you practice. Apps like Google Earth and various GIS software offer excellent ways to visualize contour lines in 3D.
Click Here To See Comprehensive Guide To Cement And Steel Grades
